• Call: +1 (858) 429-9131

Posts Tagged ‘Linux’

DevOps stories 1: working with a high traffic e-commerce portal

Looks like this is a good idea to write down first person stories of various DevOps – Cloud migration scenarios that we come across.

In this particular case we have a beast of a server with 32 processors with 8 cores each & 256 of RAM running LAMP stack, CakePHP &  X-cart shopping cart. And yes, everything is dead slow.

Cleaning up the X-cart cache

By default (?), the cache is at /var/www/html/cache or [DOCTUMENT_ROOT]/cache. If there are too many files, you will not be able to delete the files. The following commands can help.


touch /root/agileblaze/cache-file-list.txt #empty file
find . -name '.js' | grep -vFf /root/agileblaze/cache-file-list.txt | xargs /bin/rm -f
find . -name 'sql.
' | grep -vFf /root/agileblaze/cache-file-list.txt | xargs /bin/rm -f
find . -name 'rf*.php' | grep -vFf /root/agileblaze/cache-file-list.txt | xargs /bin/rm -f

The permanant fix for this X-cart behaviour is to change the following row in the config.php file from:

define('USE_SQL_DATA_CACHE', true);
to
define('USE_SQL_DATA_CACHE', false);

MySQL

There are tons of issues like a db that is not upgraded, joins without indexes etc. We decided to make use of the RAM & have MySQL MYISAM temporary files in there for faster access. Don’t forget to create the required directory and add the necessary entries /etc/fstab to persist the changes over reboots.

/etc/my.cnf is changed as follows

tmpdir = /var/mysqltmp # changed from /var/lib/mysql/tmp

Now that we have some room to look into other matters, things should be easier.

We also had the non-so-friendly max connections error. We increased in the max connections from the default.

# MAX CONNECTIONS
max_connections = 300 #Sat Apr 30 03:35:25 CDT 2016

Slow Queries

If the slow query log is enabled, mysqldumpslow can be a very handy command

[root@714219-db1 mysql]# mysqldumpslow -a -s r -t 10 /var/log/mysql/slow.log

Reading mysql slow query log from /var/log/mysql/slow.log Count: 376687 Time=1.63s (613441s) Lock=0.00s (36s) Rows=203657.1 (76714970948), 2users@localhost SELECT productid, COUNT(remote_ip) AS total, AVG(vote_value) AS rating FROM xcart_product_votes GROUP BY productid

Controlling the RAM usage


The RAM usage on GNU/Linux based systems can be sometimes quite weird. The immediate path taken is to play around with sysctl and tweak swappiness & may be run drop_cache.

ie,

change swappiness to say, 10 & do a cache + buffer cleanup. But these may not be very handy but the /proc/sys/vm/vfs_cache_pressure changes seems to help further. (we have it around 512)

Further minimum free memory size is a parameter which can help preventing OOM errors. A sample value is shown below.

sysctl -w vm.min_free_kbytes=2621440

Further:

sysctl -w vm.vfs_cache_pressure=1024
sysctl -w vm.swappiness=10


Keep an eye on Caches and Buffers

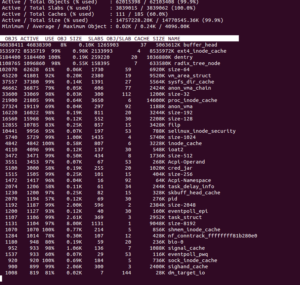
This is often something people miss.   The difference between free command and the total process usage can give us the Cache + buffer usage.  slabtop is a very handy command to get exact details.

slabtop --delay=10 -s c

Can give a neat summary.

Screenshot from 2016-05-11 20-28-07


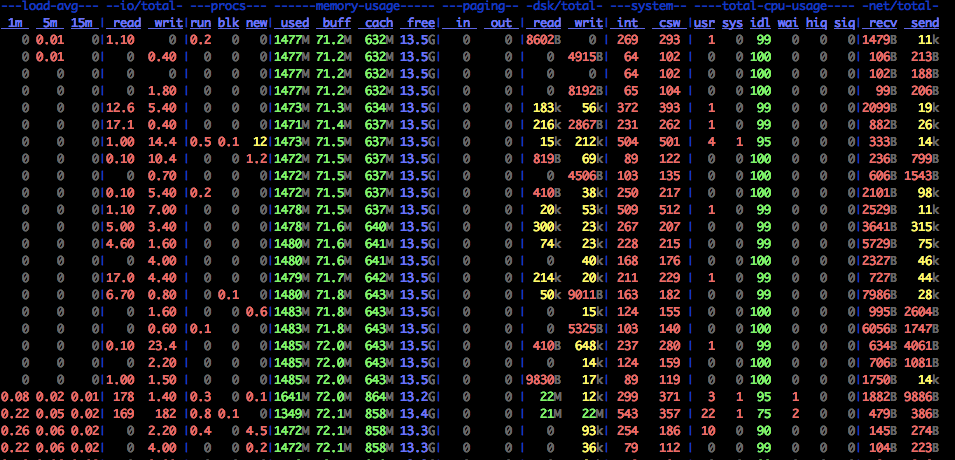
Another very useful tool is dstat

dstat -lrvn 10 output is shown below. This can give colourful details of cache usage.

the memory, CPU, network, IO columns above gives useful information.


How to read dstat : On a fully warmed-up system, memory should be around 95% in-use, with most of it in the cache column. CPUs should be in use with no more than 1-2% of iowait and 2-15% system time.


How to setup automatic updates:

Sometimes it is quite good to have automatic updates in place. For Ubuntu, automatic updates can be done following these instructions.


Mosh aka mobile-shell

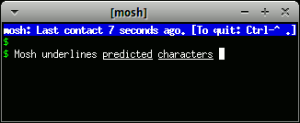
Mosh_demo_screenshot

Stumbled upon Mobile shell (Mosh) which allows persistent connection over intermittent connections, VPN – WiFi – networking roaming etc. Its quite useful especially when we have tons of nodes across multiple cloud providers & resulting attempts of their attention grabbing. Automating few things in a CRM made us  end up setting up a Postfix mail server after something like more than a decade, got frustrated over the nearly non-existent internet provided by Asianet DSL & all credit of this goes to them.


TL;DR Here is a quick guide to get Mosh working on Mac & GNU/Linux flavours.


Mosh uses UDP. Yes, you heard it right.

By default it uses 60000 to 61000 for establishing connections. We would need to open up some of these ports, say a subset of this in the fire wall mechanism that we use to get access to the servers.

There is a client & a server

I missed out this part ! Well, we need to install Mosh on the client and the server. (ie apt-get install mosh or yum install mosh on the servers too BOFH.)

On Amazon / AWS / EC2 cloud,

Open up few UDP ports in the security groups. We opened up 10 ports.

On DigitalOcean or any other provider open the ports in your firewall.

Client side installation:

On Mac,  we ran into issues with libprotobuf

> mosh migrate2cloud.com
dyld: Library not loaded: /usr/local/lib/libprotobuf.7.dylib
  Referenced from: /usr/local/bin/mosh-client
  Reason: image not found
Died at /usr/local/bin/mosh line 201. 

The solution is to upgrade Brew (well why shouldn’t one use brew ?)

brew update ; brew upgrade ;  brew remove libprotobuf ; brew install libprotobuf

will do the magic. If not,  we can try

         brew remove mosh ; brew install mosh

as well. If its doesn’t work, RTFM & the FAQ 🙂

Another issue we ran into was the locale & UTF-8 encoding. We fixed it by installing the locale in the client and server and exporting the following environment variable to the bash profile.

# for mosh
export LANG=en_US.UTF-8
export LC_ALL=en_US.UTF-8
export LC_CTYPE=en_US.UTF-8
export MM_CHARSET=utf8
export LC_COLLATE=”en_US.UTF-8″
export LC_TIME=”en_US.UTF-8″
export LC_NUMERIC=”en_US.UTF-8″
export LC_MONETARY=”en_US.UTF-8″
export LC_MESSAGES=”en_US.UTF-8″

You load the environment variables by doing the following in bash.

. ~/.bash_profile   # don’t miss the dot at the beginning

Firewalls, Tunnelling, NAT

It may not work just yet as you may have to deal with NAT traversal and other nasty things. Creating an SSH tunnel can solve these issues.

mosh –ssh=”ssh -4 -R 2222:localhost:22 -i /Users/migrate2cloud/keys/ssh-key”  root@server.com

Reattaching a detached Mosh:mobile-shell is not possible. But we can run screen inside mobile shell.

do pkill mosh-server instead … or pgrep mosh-server -> kill etc

PS: if you use CIRU.org, things may be different for you.

That’s it. DigitalOcean guys have come up with a  nice write up here which is very helpful. There is also an Android client and iOS client in the making. On GNU/Linux I use KDE Konsole & on Mac iTerm : these are 2 good tools that are very useful IMHO.

Iozone – file system benchmark quick installation

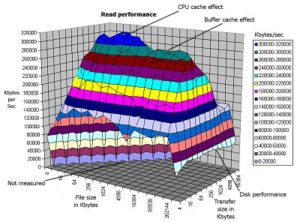
Iozone – open source file system benchmarking tool is a handy tool which  lets you to inspect  filesystem performance like read, write, rewrite, random read etc etc. Major UNI*X flavours and even Microsfot Windows is supported.

Iozone graph - file system benchmark

This is a quick how to on installation and usage on Redhat flavor Linux & MacOS.


Installation steps

  1. Download the rpm source fro the Iozone from the following link or enter the follwing command at the command prompt
wget http://www.iozone.org/src/current/iozone-3-338.i386.rpm
  1. install Iozone using the following command
rpm -ivh /path/to/iozone-3-338.i386.rpm

Now the filesystem benchmarking tool is installed. To verify the installation you can find the files of Iozone tool in the directory /opt/iozone/

Plotting graphs from Iozone analysis results

For the plotting of a graph you should ensure that gnuplot is already installed in your machine. Gnuplot is a command-driven opensource function plotting tool. If it isn’t installed you may install it using the following command

yum install gnuplot

After ensuring that you have got gnuplot installed. Lets try plotting the analysis of the Iozone tool on a graph. Here we will analyze the filesystem with in auto mode. Run th iozone command and redirect its output to a file.

/opt/iozone/bin/iozone -a -g 4m > /tmp/test_analysis

In the above command we have set the maximum size of a file for auto mode  to 4mb with -g option. For brief study about Iozone commands use

/opt/iozone/bin/iozone -h

To generate the graph there is another command which is installed with the iozone tool ie Generate_Graphs. To plot the graph use the following commands

/opt/iozone/bin/Generate_Graphs /tmp/test_analysis

A new window will pop up with the plotted graph of the write performance. At the command line if you hit enter then new graph is plotted fro the rewrite performance. Thus there will be graph plotted for many IO performances as you hit enter each time. Evaluate the required IO performances from the set of graphs depending on the application that you are planning to deploy.


If you have brew installed, its as simple as

brew install iozone

Apache on the Cloud – The things you should know

    LAMP forms the base of most web applications.  As the load on an server increases, the bottlenecks in the underlying infrastructure become more apparent in the form of slow response to user requests.

     To overcome this slow response  the primary choice of most people is to add more hardware resources ( incase of AWS increasing the instance type). This will definitely  increases performance but will cost you more money.  The webserver and database eat most of the resources. Most commonly used web server is apache and database is MySQL. So if we can optimize these two we can improve the performance.

   Apache optimization techniques can often provide significant acceleration boosts  even when other acceleration techniques are in use, such as a CDN.  mod_pagespeed is a module from Google for Apache HTTP Servers that can improve the page load times of your website. you can read more on this from here.  If you want to deploy a PHP app on AWS Cloud, Its better to using some kind of caching mechanism.  Its already discussed in our blog .

      Once we came into a situation where we have to use a micro instance for a web server with less than 500 hits a day

      When the site started running live, and we feel like disappointed. when accessing website, it would sometimes pause for several seconds before serving the requested page. It took  hours to figure out what was going on. finally we run the command top and quickly discovered that when the site was accessing by certain amount of users the CPU would spike, but the spike was not the typical user or system CPU. For testing what’s happening in  server we used the apache benchmark tool ‘ab’ and run the following command on  localhost.

                                             #ab -n 100 -c 10 http://mywebserver.com/

      This will show  how fast our web server can handle 100 requests, with a maximum of 10 requests running concurrently. In the meantime we were monitoring the output of top command on web server.

     For further investigation we started with  sar – Linux command to  Collect, report, or save system activity information

  #sar 1

      According to amazon documentation “Micro instances (t1.micro) provide a small amount of consistent CPU resources and allow you to increase CPU capacity in short bursts when additional cycles are available”.

       If you use 100% CPU for more than a few minutes, Amazon will “steal” CPU time from the instance, meaning that they throttle your instance.  This last  as long as five minutes, and then you get a few seconds of 100% again, then the restrictions are back.  This will effect your website, making it slow, and even timing-out requests. basically means the physical hardware is busy and the hypervisor can’t give the VM the amount of CPU cycles it wants.

   Real tuning required on prefork. This is where we can tell apache to only generate so many processes. The defaults values  are high, and which cant be handled by micro instance. Suppose you get 10 concurrent requests for a php page and require around 64MB of RAM when requested (you have to make sure that  php memory_limit is above that value). That’s around 640MB of RAM on micro instance of 613MB RAM.  This is the case  with 10 connections – apache is configured to allow 256 clients by default,  We need to  scale these down , normally with 10-12 MaxClients. As per out case, this is still a huge number because 10-12 concurrent connections would use all our memory. If you want to be really cautious, make sure that your max memory usage is less than 613MB. Something like 64M php memory limit and 8 max clients keeps you under your limit with space to spare – this helps ensure that our MySQL process when your server is under load.

           Maxclients an important tuning parameter regarding the performance of the Apache web server. We can calculate the value of this for a t1.micro instance

Theoretically,

MaxClients =(Total Memory – Operating System Memory – MySQL memory) / Size Per Apache process.

t1.micro have a server with 613MB of Total memory. Suppose We are using RDS instead of mysql server.

Stop apache and run

#ps aux | awk ‘{sum1 +=$4}; END {print sum1}’.

 we will get the amount of memory thats used by processes other than apache.

Suppose we get a value around 30.

from top command we can check the average memory that each apache resources use.

suppose its 60mb.

Max clients = (613 – 30 ) 60 = 9.71 ~ 10 approx …

       Micro instances are awesome, especially when cost becomes a major concern, however that they are not right for all applications. A simple website with only a few hundreds  hits a day will do just fine since it will only need CPU in short bursts.

      For Servers that serves dynamic content, better approach is to employ a reverse-proxy. This would be done this apache’s mod_proxy or Squid. The main advantages of this configurations are content caching, load balancing etc. Easy method is to use mod_proxy and the ProxyPass directive to pass content to another server. mod_proxy supports a degree of caching that can offer a significant performance boost. But another advantage is that since the proxy server and the web server are likely to have a very fast interconnect, the web server can quickly serve up large content, freeing up a apache process, why the proxy slowly feeds out the content to clients

If you are using ubuntu, you can enable module by

                                        #a2enmod proxy

                                        #a2enmod proxy_http    

and in apache2.conf

                                         ProxyPass  /  http://192.168.1.46/

                                         ProxyPassReverse  /   http://192.168.1.46/

         The ProxyPassreverse directive captures the responses from the web server and masks the URL as it would be directly responded by the Apache  hiding the identity/location of the web server. This is a good security practice, since the attacker won’t be able to know the ip of our web server.

      Caching with Apache2 is another important consideration.  We can configure apache  to set the Expires HTTP header, max-age directive of the Cache-Control HTTP header of static files ,such as images, CSS and JS files, to a date in the future so that these files will be cached by your visitors browsers. This saves bandwidth and makes web site appear faster if a user visits your site for a second time, static files will be fetched from the browser cache

                                      #a2enmod expires

  edit  /etc/apache2/sites-available/default

  <IfModule mod_expires.c>
               ExpiresActive On
               ExpiresByType image/gif “access plus 4 weeks”
               ExpiresByType image/jpg “access plus 4 weeks”

</IfModule>

This would tell browsers to cache .jpg, .gif  files for four week.

       If your server requires a large amount of read / write operations, you might consider provisioned IOPS ebs volumes on your server. This is really effective if you use database server on ec2 instances.  we can use iostat on the command line to take a look at your read/sec and write/sec. You can also use CloudWatch metrics to determine read and write operations.

       Once we move to the security side of apache, our major concern is DDos attacks. If a server is under a DDoS attack, it is quite difficult to detect the attack before the damage is done.  Attack packets usually have spoofed source IP addresses. Hence, it is more difficult to trace them back to their real source. The limit on the number of simultaneous requests that will be served by Apache is decided by the MaxClients directive, and is set to safe limit, by default. Any connection attempts over this limit will normally be queued up.

     If you want to protect your apache against DOS,  DDOS attacks use mod_evasive module.  This module is designed specifically as a remedy for Apache DoS attacks. This module will allow you to specify a maximum number of requests executed by the same IP address. If the limit is reached, the IP address is blacklisted for the time period you specify.

Installation of MongoDB and its performance test

Why MongoDB?

  • Document-oriented
    • Documents (objects) map nicely to programming language data types
    • Embedded documents and arrays reduce need for joins
    • Dynamically-typed (schemaless) for easy schema evolution
    • No joins and no multi-document transactions for high performance and easy scalability
  • High performance
    • No joins and embedding makes reads and writes fast
    • Indexes including indexing of keys from embedded documents and arrays
    • Optional streaming writes (no acknowledgements)
  • High availability
    • Replicated servers with automatic master failover
  • Easy scalability
    • Automatic sharding (auto-partitioning of data across servers)
    • Reads and writes are distributed over shards
    • No joins or multi-document transactions make distributed queries easy and fast
    • Eventually-consistent reads can be distributed over replicated servers

Mongo data model

  • A Mongo system (see deployment above) holds a set of databases
  • A database holds a set of collections
  • A collection holds a set of documents
  • A document is a set of fields
  • A field is a key-value pair
  • A key is a name (string)
  • A value is a
    • basic type like string, integer, float, timestamp, binary, etc.,
    • a document, or
    • an array of value

    Mongo query language

  • To retrieve certain documents from a db collection, you supply a query document containing the fields the desired documents should match. For example, {name: {first: 'John', last: 'Doe'}} will match all documents in the collection with name of John Doe. Likewise, {name.last: 'Doe'} will match all documents with last name of Doe. Also, {name.last: /^D/} will match all documents with last name starting with ‘D’ (regular expression match).
  • Queries will also match inside embedded arrays. For example, {keywords: 'storage'} will match all documents with ‘storage’ in its keywords array. Likewise, {keywords: {$in: ['storage', 'DBMS']}} will match all documents with ‘storage’ or ‘DBMS’ in its keywords array.
  • If you have lots of documents in a collection and you want to make a query fast then build an index for that query. For example, ensureIndex({name.last: 1}) or ensureIndex({keywords: 1}). Note, indexes occupy space and slow down updates a bit, so use them only when the tradeoff is worth it.

Install MongoDB on Ubuntu 10.04

Configure Package Management System (APT)

The Ubuntu package management tool (i.e. dpkg and apt) ensure package consistency and authenticity by requiring that distributors sign packages with GPG keys. Issue the following command to import the 10gen public GPG Key:

sudo apt-key adv --keyserver keyserver.ubuntu.com --recv 7F0CEB10

Create a /etc/apt/sources.list.d/10gen.list file and include the following line for the 10gen repository.

deb http://downloads-distro.mongodb.org/repo/ubuntu-upstart dist 10gen

Now issue the following command to reload your repository:

sudo apt-get update

Install Packages

Issue the following command to install the latest stable version of MongoDB:

sudo apt-get install mongodb-10gen

When this command completes, you have successfully installed MongoDB! Continue for configuration and start-up suggestions.

Configure MongoDB

These packages configure MongoDB using the /etc/mongodb.conf file in conjunction with the control script. You will find the control script is at /etc/init.d/mongodb.

This MongoDB instance will store its data files in the /var/lib/mongodb and its log files in /var/log/mongodb, and run using the mongodb user account.

Note

If you change the user that runs the MongoDB process, you will need to modify the access control rights to the /var/lib/mongodb and /var/log/mongodb directories.

Controlling MongoDB

Starting MongoDB

You can start the mongod process by issuing the following command:

sudo service mongodb start

You can verify that mongod has started successfully by checking the contents of the log file at /var/log/mongodb/mongodb.log.

Stopping MongoDB

As needed, you may stop the mongod process by issuing the following command:

sudo service mongodb stop

Restarting MongoDB

You may restart the mongod process by issuing the following command:

sudo service mongodb restart

Controlling mongos

As of the current release, there are no control scripts for mongos. mongos is only used in sharding deployments and typically do not run on the same systems where mongod runs. You can use the mongodb script referenced above to derive your own mongos control script.

Using MongoDB

Among the tools included with the MongoDB package, is the mongo shell. You can connect to your MongoDB instance by issuing the following command at the system prompt:

mongo
> show dbs (); —> To show your databases
> use <databasename> —-> To switch database
> db.createCollection(“collectionname”) —> To create collection
> db.collectionname.find(); —> To see the contents in the collection
> db.addUser(“theadmin”, “anadminpassword”) —> To create user and password

Mongodb performance test :-

To monitor database system we can use Mongotop

Mongotop tracks and reports the current read and write activity of a MongoDB instance.
Mongotop provides per-collection visibility into use.
Use mongotop to verify that activity and use match expectations.
Mongotop returns time values specified in milliseconds (ms.)
Mongotop only reports active namespaces or databases, depending on the –locks option.
If you don’t see a database or collection, it has received no recent activity.

By default mongotop connects to the MongoDB instance running on the localhost port 27017. However,mongotop can optionally connect to remote mongod instances

Next, we can use Mongostat

Mongostat captures and returns counters of database operations. Mongostat reports operations on a per-type (e.g. insert, query, update, delete, etc.) basis. This format makes it easy to understand the distribution of load on the server. Use  Mongostat to understand the distribution of operation types and to inform capacity planning.
The Mongostat utility provides a quick overview of the status of a currently running mongod or Mongos instance. Mongostat is functionally similar to the UNIX/Linux file system utility vmstat, but provides data regarding mongod and Mongos instances.

Use  db.serverStatus()
It provides an overview of the database process’s state.

Then REST interface

MongoDB provides a REST interface that exposes a diagnostic and monitoring information in a simple web page. Enable this by setting rest to true, and access this page via the local host interface using the port numbered 1000 more than that the database port. In default configurations the REST interface is accessible on 28017. For example, to access the REST interface on a locally running mongod instance: http://localhost:28017

These are a few basic tips on making your application better/faster/stronger without knowing anything about indexes or sharding.

Connecting

Connecting to the database is a (relatively) expensive operation. Try to minimize the number of times you connect and disconnect: use persistent connections or connection pooling (depending on your language).

there are some  side effects with the PHP connection code.

$connection = new Mongo ( );

$connection->connect( );

In this code it appears the user wants to create a new connection. However, under the hood the following is happening:

The constructor connects to the database.
connect( ) sees that you’re already connected, assumes you want to reset the connection.
Disconnects from the database.
Connects again.

The result is that you have doubled your execution time.

ObjectIds

ObjectIds seem to be uncomfortable, so they convert their ObjectIds into strings. The problem is, an ObjectId takes up 12 bytes but its string representation takes up 29 bytes (almost two and a half times bigger).

Numbers vs. Strings

MongoDB is type-sensitive and it’s important to use the correct type: numbers for numeric values and strings for strings.

If you have large numbers and you save them as strings (“1234567890″ instead of 1234567890), MongoDB may slow down as it strcmps the entire length of the number instead of doing a quicker numeric comparison. Also, “12″ is going to be sorted as less than “9″, because MongoDB will use string, not numeric, comparison on the values. This can lead to some errors.

Driver-specific
Find out if you’re driver is particularly weaknesses (or strengths). For instance, the Perl driver is one of the fastest drivers, but it is not good at decoding Date types (Perl’s DateTime objects take a long time to create).
MongoDB adopts a documented-oriented format, so it is more similar to RDBMS than a key-value or column oriented format.

MongoDB operates on a memory base and places high performance above data scalability.Mongo DB uses BSON for data storage

Mongo uses memory mapped files, which means that a lot of the memory reported by tools such as top may not actually represent RAM usage. Check mem[“resident”], which tells you how much RAM Mongo is actually using.

“mem” : {
    “resident” : 2,
    “virtual” : 2396,

    “supported” : true,
    “mapped” : 0
},

Backup

There are basically two approaches to backing up a Mongo database:

Mongodump and Mongorestore are the classic approach. Dumps the contents of the database to files. The backup is stored in the same format as Mongo uses internally, so is very efficient. But it’s not a point-in-time snapshot.
To get a point-in-time snapshot, shut the database down, copy the disk files (e.g. with cp) and then start mongod up again. Alternatively, rather than shutting mongod down before making your point-in-time snapshot, you could just stop it from accepting writes:

> db._adminCommand({fsync: 1, lock: 1})
{
        “info” : “now locked against writes, use db.$cmd.sys.unlock.findOne() to unlock”,

        “ok” : 1
}

To unlock the database again, you need to switch to the admin database and then unlock it

> use admin
switched to db admin
> db.$cmd.sys.unlock.findOne()
{ “ok” : 1, “info” : “unlock requested” }

Replication
Start your master and slave up like this:

$ mongod –master –oplogSize 500

$ mongod –slave –source localhost:27017 –port 3000 –dbpath /data/slave

When seeding a new slave server from master use the –fastsync option.

You can see what’s going on with these two commands:
> db.printReplicationInfo() # tells you how long your oplog will last
> db.printSlaveReplicationInfo() # tells you how far behind the slave is

If the slave isn’t keeping up,Check the mongo log for any recent errors. Try connecting with the mongo
console. Try running queries from the console to see if everything is working. Run the status commands
above to try and find out which database is taking up resources.
Timeout

Connection timeout in milliseconds. Defaults to 20000

Connection::query_timeout.

How many milliseconds to wait for a response from the server. Set to 30000 (30 seconds) by default. -1 waits forever (or until TCP times out, which is usually a long time).

Default pool

The default pool has a maximum of 10 connections per mongodb host. This value is controlled by the variable  “connectionsPerHost” within the class

MongoDB Server Connections

The MongoDB server has a property called “maxConns” that  is the max number of simultaneous connections. The
default number for maxConns is 80% of the available file descriptors for connections. One way to check the number of connections is by opening the mongo shell and executing:

>db.serverStatus() and in the previous mail I have send the screen shot of this.

The standard format of the MongoDB connection URI used to connect to a MongoDB database server.

mongodb://[username:password@]host1[:port1][,host2[:port2],…[,hostN[:portN]]][/[database][?options]]

Finding the Min and Max values in MongoDB

In MongoDB, the min() and max() functions work as limitors – essentially the same as “gte” (>=) and “lt” (<).

To find the highest (maximum) value in MongoDB, you can use this command;

db.thiscollection.find().sort({“thisfieldname”:-1}).limit(1)

This essentially sorts the data by the fieldname in decending and takes the first value.

The lowest (minimum) value can be determined in a similar way.

    db.thiscollection.find().sort({“thisfieldname”:1}).limit(1)

Memory Mapped Storage Engine :-

This is the current storage engine for MongoDB, and it uses memory-mapped files for all disk I/O.  Using this strategy, the operating system’s virtual memory manager is in charge of caching.  This has several implications:

There is no redundancy between file system cache and database cache: they are one and the same.
MongoDB can use all free memory on the server for cache space automatically without any configuration of a cache size.
Virtual memory size and resident size will appear to be very large for the mongod process.

This is benign: virtual memory space will be just larger thanthe size of the datafiles open and mapped; resident size will vary depending on the amount of memory not used by other processes on the machine.

This command shows the memory usage information :- db.serverStatus().mem

For example :-

> db.serverStatus().mem
{
    “bits” : 64,
    “resident” : 31,
    “virtual” : 146,
    “supported” : true,
    “mapped” : 0,
    “mappedWithJournal” : 0
}

We can verify there is no memory leak in the mongod process by comparing the mem.virtual and mem.mapped values (these values are in megabytes).  If you are running with journaling disabled, the difference should be relatively small compared to total RAM on the machine. If you are running with journaling enabled, compare mem.virtual to 2*mem.mapped.   Also watch the delta over time; if it is increasing consistently, that could indicate a leak.

Also we can use to check what percent of memory is being used for memory mapped files by the free command:

Here 2652mb of memory is being used to memory map files

root@manager-desktop:~# free -tm

             total       used       free     shared    buffers     cached
Mem:          3962       3602        359          0        411       2652

-/+ buffers/cache:        538       3423

Swap:        1491        52       1439

Total:        5454       3655   1799

Garbage collection handling :-

When we remove an object from MongoDB collection, the space it occupied is not automatically garbage collected and new records are only appended to the end of data files, making them grow bigger and bigger.MongoDB maintains lists of deleted blocks within the datafiles when objects or collections are deleted.  This space is reused by MongoDB but never freed to the operating system.

To shrink the amount of physical space used by the datafiles themselves, by reclaiming deleted blocks, we must rebuild the database by using  the command “db.repairDatabase( )” . repairDatabase copies all the database records to new files.

We will need enough free disk space to hold both the old and new database files while the repair is running, the repairDatabase  will take a long time to complete.Also rather than compacting an entire database,

you can compact just a single collection by using  “db.runCommand({compact:’collectionmname;})

This does not shrink any datafiles,however; it only defragments deleted space so that larger objects might reuse it.

The compact command will never delete or shrink database files, and in general requires extra space to do its work.

Thus, it is not a good option when you are running critically low on disk space.

SSL for Tomcat on AWS EC2

To launch an AWS/EC2 instance, at first setting up a security group to specify what network traffic is allowed to reach the instance. Then select an AMI and launch an instance from it. And create a volume in the same zone of the instance and attach with it. Format the device and mount it to a directory. After that follow the steps to create SSL for Tomcat:

1. For the tomcat we need java, so create a directory to save the Java Binary file.

[shell] mkdir /usr/java
cd /usr/java [/shell]

2. Download jdk binary file (jdk-x-linux-ix.bin) here
Use URL http://www.oracle.com/technetwork/java/archive-139210.html

3. Execute the Binary file

[shell] /usr/java/jdk-x-linux-ix.bin [/shell]

Now we have the Java in our device. Then Download the Tomcat and install it followed by the instructions:-

1. Create a directory to save the tomcat

[shell] mkdir /usr/tomcat
cd /usr/tomcat [/shell]

2. Download tomcat source file (apache-tomcat-x.tar.gz) here
Use URL http://apache.hoxt.com/tomcat/tomcat-6/v6.0.32/bin/

3. Extract that file

[shell] tar -zxvf apache-tomcat-x.tar.gz [/shell]

4. Edit the catalina.sh file

[shell] vim /usr/tomcat/apache-tomcat-x/bin/catalina.sh [/shell]

[shell]

#** Add at the top **
JAVA_HOME=/usr/java/jdk1.x.x_x

[/shell]

save and exit
5. Start the tomcat

[shell] /usr/tomcat/apache-tomcat-x/bin/startup.sh [/shell]

6. We can see the logs by using the given command

[shell]tail -f /usr/tomcat/apache-tomcat-x/logs/catalina.out [/shell]

7. Take the browser and enter the URL http://localhost
Now we can see the tomcat index page

8. To stop the tomcat

[shell]/usr/tomcat/apache-tomcat-x/bin/shutdown.sh [/shell]

Now configure the SSL Certificate for tomcat. When you choose to activate SSL on your web server you will be prompted to complete a number of questions about the identity of your website and your company. Your web server then creates two cryptographic keys – a Private Key and a Public Key. The Public Key does not need to be secret and is placed into a Certificate Signing Request (CSR) – a data file also containing your details.

Create a self signed certificate authority (CA) and keystore.

1. Make a directory to hold the certs and keystore. This might be something like:

[shell] mkdir /usr/tomcat/ssl
cd /usr/tomcat/ssl [/shell]

2. Generate a private key for the server and remember it for the next steps

[shell]openssl genrsa -des3 -out server.key 1024[/shell]

Generating RSA private key, 1024 bit long modulus
…………………..++++++
…++++++
e is 65537 (0x10001)
Enter pass phrase for server.key:
Verifying – Enter pass phrase for server.key:

3. Generate a CSR (Certificate Signing Request). Give the data after executing this command

[shell]openssl req -new -key server.key -out server.csr[/shell]

Enter pass phrase for server.key:
You are about to be asked to enter information that will be incorporated
into your certificate request.
What you are about to enter is what is called a Distinguished Name or a DN.
There are quite a few fields but you can leave some blank
For some fields there will be a default value,
If you enter ‘.’, the field will be left blank.
—–
Country Name (2 letter code) [GB]:
State or Province Name (full name) [Berkshire]:
Locality Name (eg, city) [Newbury]:
Organization Name (eg, company) [My Company Ltd]:
Organizational Unit Name (eg, section) []:
Common Name (eg, your name or your server’s hostname) []:
Email Address []:

Please enter the following ‘extra’ attributes
to be sent with your certificate request
A challenge password []:
An optional company name []:

4. Remove the passphrasse from the key

[shell]cp server.key server.key.org
openssl rsa -in server.key.org -out server.key[/shell]

Enter pass phrase for server.key.org:
writing RSA key

5. Generate the self signed certificate

[shell]openssl x509 -req -days 365 -in server.csr -signkey server.key -out server.crt[/shell]

Signature ok
subject=/C=GB/ST=Berkshire/L=Newbury/O=My Company Ltd
Getting Private key

You should then submit the CSR. During the SSL Certificate application process, the Certification Authority will validate your details and issue an SSL Certificate containing your details and allowing you to use SSL. Typically an SSL Certificate will contain your domain name, your company name, your address, your city, your state and your country. It will also contain the expiration date of the Certificate and details of the Certification Authority responsible for the issuance of the Certificate.

Create a certificate for tomcat and add both to the keystore

1. Change the path to ssl

[shell]cd /usr/tomcat/ssl[/shell]

2. Create a keypair for ‘tomcat’

[shell]keytool -genkey -alias tom -keyalg RSA -keystore tom.ks[/shell]

Enter keystore password:
Re-enter new password:
What is your first and last name?
[Unknown]:
What is the name of your organizational unit?
[Unknown]:
What is the name of your organization?
[Unknown]:
What is the name of your City or Locality?
[Unknown]:
What is the name of your State or Province?
[Unknown]:
What is the two-letter country code for this unit?
[Unknown]:

Is CN=Unknown, OU=Unknown, O=Unknown, L=Unknown, ST=Unknown, C=Unknown correct?
[no]: yes

Enter key password for <tom>
(RETURN if same as keystore password):
Re-enter new password:

3. Generate a CSR (Certificate Signing Request) for tomcat

[shell]keytool -keystore tom.ks -alias tom -certreq -file tom.csr[/shell]

Enter keystore password:

4. create unique serial number

[shell]echo 02 > serial.txt[/shell]

5. Sign the tomcat CSR

[shell]openssl x509 -CA server.crt -CAkey server.key -CAserial serial.txt -req -in tom.csr -out tom.cer -days 365[/shell]

Signature ok
subject=/C=Unknown/ST=Unknown/L=Unknown/O=Unknown/OU=Unknown/CN=Unknown
Getting CA Private Key

6. Import the server CA certificate into the keystore

[shell]keytool -import -alias serverCA -file server.crt -keystore tom.ks[/shell]

Enter keystore password:
Owner: O=My Company Ltd, L=Newbury, ST=Berkshire, C=GB
Issuer: O=My Company Ltd, L=Newbury, ST=Berkshire, C=GB
Serial number: ee13c90cb351968b
Valid from: Thu May 19 02:12:51 EDT 2011 until: Fri May 18 02:12:51 EDT 2012
Certificate fingerprints:
MD5: EE:F0:69:01:4D:D2:DA:A2:4E:88:EF:DC:A8:3F:A9:00
SHA1: 47:97:72:EF:30:02:F7:82:BE:CD:CA:F5:CE:4E:ED:89:73:23:4E:24
Signature algorithm name: SHA1withRSA
Version: 1
Trust this certificate? [no]: yes
Certificate was added to keystore

7. Add the tomcat certificate to the keystore

[shell]keytool -import -alias tom -file tom.cer -keystore tom.ks[/shell]

Enter keystore password:
Certificate reply was installed in keystore

To configure a secure (SSL) HTTP connector for Tomcat, verify that it is activated in the $TOMCAT_HOME/conf/server.xml file. Edit this file and add the following lines.

Tomcat configuration

1. Edit the given portion of tomcat configuretion file and change the port as 80

[shell]vim /usr/tomcat/apache-tomcat-6.0.13/conf/server.xml[/shell]

[shell]“””””” <Connector port=”8080″ protocol=”HTTP/1.1″
connectionTimeout=”20000″
redirectPort=”8443″ /> “”””””

<Connector port=”80″ protocol=”HTTP/1.1″
connectionTimeout=”20000″
redirectPort=”8443″ />

[/shell]

2. Add the given portion to server.xml and give your password in the password portion

[shell]

<Connector port=”443″ protocol=”HTTP/1.1″ SSLEnabled=”true”
maxThreads=”150″ scheme=”https” secure=”true”
keystoreFile=”tom.ks”
keystorePass=”password”
clientAuth=”false” sslProtocol=”TLS” />

[/shell]

When you start the Tomcat Your web server will match your issued SSL Certificate to your Private Key. Your web server will then be able to establish an encrypted link between the website and your customer’s web browser.

Start the tomcat with SSL Certificate

1. Restart tomcat

[shell]/usr/tomcat/apache-tomcat-6.0.13/bin/shutdown.sh
/usr/tomcat/apache-tomcat-6.0.13/bin/startup.sh[/shell]

2. Go to https://Public DNS name:443/

Then your browser shows a security issue. Click the Approve button. Then you can enter to the tomcat with your certificate. When a browser connects to a secure site it will retrieve the site’s SSL Certificate and check that it has not expired, it has been issued by a Certification Authority the browser trusts, and that it is being used by the website for which it has been issued. If it fails on any one of these checks the browser will display a warning to the end user letting them know that the site is not secured by SSL.

You are Done !!!

MySQL Optimization

Database optimization is the process of configuring database to use system resource efficiently and perform tasks quickly. To optimize mysql you should know the work flow of entire system, your hardware, operating system, disk I/O performance etc.
Why to Optimize
You can do more with less. The default mysql setup is optimized for a minimal system because it should work well on a minimal hardware. But when you use a dedicated mysql server with high traffic and complex queries you have to optimize mysql.
MySQL Server tuning Considerations
Here you will find some common optimization parameters.

  • MySQL variables
  • Hardware
  • Disk
  • Application

MySQL Optimization
MySQL global variables don’t have any predefined optimum values. It is a trial and monitor process. It depends on all the above parameters. Here you will see some of the common parameters.
Key-buffer-size
It is size of the buffer used to index blocks for MyISAM tables. On a dedicated mysql server with MyISAM storage engine 25-30% of systems total memory you can allocate for key_buffer_size. To fine tune key_buffer_size you can compare the variables key_reads and the key_read_requests.
This ratio should be at least 1:100.

SHOW STATUS LIKE ‘%key_read%’;
+——————-+————-+
| Variable_name | Value |
+——————-+————-+
| Key_read_requests | 10726813161 |
| Key_reads | 92790146 |
+——————-+————-+
Here the ratio is 1:115 which is acceptable.
But suppose you get a ratio 1: 10 then you need to add more key buffer and upgrade hardware accordingly.
Query Cache
“My website is too slow while loading dynamic pages”. If it is a mysql database related issue, following MySQL variables will be your solution.
query_cache_type
Set the query cache type. There are 3 values 0 ,1 or 2

0 Do not cache any query result
1 Cache query results.
2 Cache results ondemand. Cacheable queries that begin with SELECT SQL_CACHE.

query_cache_size
The amount of memory used to cache query result. Default is 0 which disable query cache.
The optimum value is depend on your application.
query_cache_limit
Do not cache results that are larger than this number of bytes. The default value is 1MB.
Status checking
SHOW STATUS LIKE ‘%qcache%’;
+————————-+———-+
| Variable_name | Value |
+————————-+———-+
| Qcache_free_blocks | 1 |
| Qcache_free_memory | 8371272 |
| Qcache_hits | 23547551 |
| Qcache_inserts | 46909131 |
| Qcache_lowmem_prunes | 5110536 |
| Qcache_not_cached | 2760196 |
| Qcache_queries_in_cache | 0 |
| Qcache_total_blocks | 1 |
+————————-+———-+
There were 46909131 queries and out which 23547551 queries cached and remaining not cached. Here the issue will either the result is greater than query_cache_limit or greater than query_cache_size itself. You have to trial and monitor 🙂
Qcache_lowmem_prunes.
When a query is removed from the query cache, this value will be incremented. If it increases quickly, and you still have memory to spare, you can set query_cache_size high, If it never increases, you can reduce the cache size.

sort_buffer
The sort_buffer is a useful for speed up myisamchk operations. It can also be useful when performing large numbers of sorts.

tmp_table_size

This variable determines the maximum size for a temporary table in memory. The maximum in memory size is minimum of tmp_table_size and max_heap_table_size. You can compare
Created_tmp_disk_tables and Created_tmp_tables to optimize tmp_table_size.

innodb_buffer_pool_size

This variable is target for innodb table and it is similar to key_buffer_size in MyISAM table.
On a dedicated mysql server using innodb you can set this upto 80% of RAM.
Hardware for mysql
If you have large tables(>3GB), you should consider 64 bit hardware as mysql uses a lots of 64bit integers internally.

You need more memory(RAM) if you want mysql to handle large number of connections simultaneously. More RAM will speed up key updates by keeping most of the pages in RAM

Another consideration is Ethernet device, You can use a 1G Ethernet for a dedicated mysql server for fast remote connections.

Disk performance is also an important parameter.
Disk Optimization
Striping disk (RAID 0) will increase both read and write throughput.

Don’t use RAID 1 or mirroring on disk for temporary files.

On Linux, mount the disks with async (default) and noatime.
Optimizing your application
Cache process in your application

Specify the column name in queries(eg dont use SELECT * FROM……)

Use persistent connections

USE EXPLAIN to explain!!.You will see detail below.

Queries and Indexes

Let us start with a simple query SELECT firstname FROM student WHERE id=’145870′;
MySQL start searching from the beginning row to find the student with id 145870. It does not even know it exist or not. An index is a sorted file which have an entry for each row.MySQL can find the corresponding record very quickly by referring this index.
EXPLAIN is a nice tool to understand your queries

EXPLAIN SELECT firstname,lastname FROM student WHERE id=’145870′;

+———-+——+—————+——+———+——+——+————+
| table | type | possible_keys | key | key_len | ref | rows | Extra |
+———-+——+—————+——+———+——+——+————+
| student | ALL | NULL | NULL | NULL | NULL |10000 | where used |
+———-+——+—————+——+———+——+——+————+
The possible_keys is null. In this case mysql will check all the 10000 rows. We can say this query(or table) is not optimized.

Now suppose we have use index for above table and run EXPLAIN again then we will get
+———-+——-+—————+———+———+——-+——+——-+
| table | type | possible_keys | key | key_len | ref | rows | Extra |
+———-+——-+—————+———+———+——-+——+——-+
| employee | const | PRIMARY | PRIMARY | 10 | const | 1 | |
+———-+——-+—————+———+———+——-+——+——-+
The type is “const”, which means that the table has only one matching row. The primary key is being used to find this particular record.

There are many more optimization variables and indxing methods. It is difficult include everything in a single article. But you can start mysql fine tuning while you database is underperfoming.