Looks like this is a good idea to write down first person stories of various DevOps – Cloud migration scenarios that we come across.
In this particular case we have a beast of a server with 32 processors with 8 cores each & 256 of RAM running LAMP stack, CakePHP & X-cart shopping cart. And yes, everything is dead slow.
Cleaning up the X-cart cache
By default (?), the cache is at /var/www/html/cache or [DOCTUMENT_ROOT]/cache. If there are too many files, you will not be able to delete the files. The following commands can help.
touch /root/agileblaze/cache-file-list.txt #empty file

find . -name '.js' | grep -vFf /root/agileblaze/cache-file-list.txt | xargs /bin/rm -f

find . -name 'sql.' | grep -vFf /root/agileblaze/cache-file-list.txt | xargs /bin/rm -f

find . -name 'rf*.php' | grep -vFf /root/agileblaze/cache-file-list.txt | xargs /bin/rm -f
The permanant fix for this X-cart behaviour is to change the following row in the config.php file from:
define('USE_SQL_DATA_CACHE', true);

to

define('USE_SQL_DATA_CACHE', false);
MySQL
There are tons of issues like a db that is not upgraded, joins without indexes etc. We decided to make use of the RAM & have MySQL MYISAM temporary files in there for faster access. Don’t forget to create the required directory and add the necessary entries /etc/fstab to persist the changes over reboots.
/etc/my.cnf is changed as follows
tmpdir = /var/mysqltmp # changed from /var/lib/mysql/tmp
Now that we have some room to look into other matters, things should be easier.
We also had the non-so-friendly max connections error. We increased in the max connections from the default.
# MAX CONNECTIONS

max_connections = 300 #Sat Apr 30 03:35:25 CDT 2016
Slow Queries
If the slow query log is enabled, mysqldumpslow can be a very handy command
[root@714219-db1 mysql]# mysqldumpslow -a -s r -t 10 /var/log/mysql/slow.log
Reading mysql slow query log from /var/log/mysql/slow.log Count: 376687 Time=1.63s (613441s) Lock=0.00s (36s) Rows=203657.1 (76714970948), 2users@localhost SELECT productid, COUNT(remote_ip) AS total, AVG(vote_value) AS rating FROM xcart_product_votes GROUP BY productid
Controlling the RAM usage
The RAM usage on GNU/Linux based systems can be sometimes quite weird. The immediate path taken is to play around with sysctl and tweak swappiness & may be run drop_cache.
ie,
change swappiness to say, 10 & do a cache + buffer cleanup. But these may not be very handy but the /proc/sys/vm/vfs_cache_pressure changes seems to help further. (we have it around 512)
Further minimum free memory size is a parameter which can help preventing OOM errors. A sample value is shown below.
sysctl -w vm.min_free_kbytes=2621440
Further:
sysctl -w vm.vfs_cache_pressure=1024

sysctl -w vm.swappiness=10
Keep an eye on Caches and Buffers
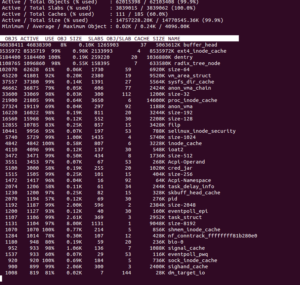
This is often something people miss. The difference between free command and the total process usage can give us the Cache + buffer usage. slabtop is a very handy command to get exact details.
slabtop --delay=10 -s c
Can give a neat summary.
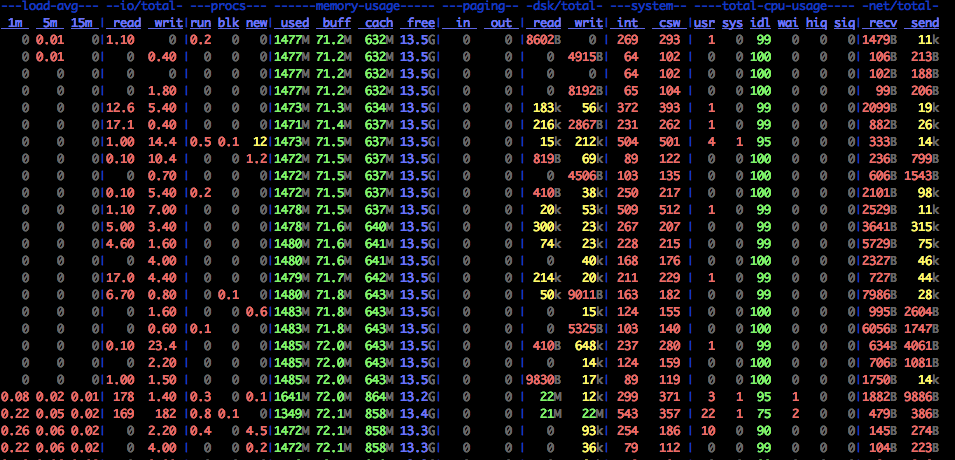
Another very useful tool is dstat
dstat -lrvn 10 output is shown below. This can give colourful details of cache usage.
How to read dstat : On a fully warmed-up system, memory should be around 95% in-use, with most of it in the cache column. CPUs should be in use with no more than 1-2% of iowait and 2-15% system time.
How to setup automatic updates:
Sometimes it is quite good to have automatic updates in place. For Ubuntu, automatic updates can be done following these instructions.


